Learn Option Chain Analysis for Better Trading
Options trading has become increasingly popular among traders because it offers multiple opportunities to profit from market movements. However, many traders struggle to identify market direction, select the right strike prices, and understand where major buying and selling activity is taking place. This is where Option Chain Analysis becomes an important part of trading.
Option Chain Analysis helps traders understand market sentiment, Open Interest activity, support and resistance levels, and trader positioning across different strike prices. By studying option chain data, traders can gain valuable insights into how market participants are reacting to current market conditions and where important trading opportunities may exist.
Whether you trade Nifty options, Bank Nifty options, or stock options, understanding Option Chain Analysis can help improve your market analysis and trading decisions. In this complete guide, you will learn about Option Chain Analysis, understand its key components, and discover how traders use it to make better trading decisions.
What is Option Chain Analysis?
Option Chain Analysis is the process of studying option chain data to understand market sentiment, trader activity, and potential market direction. An option chain displays important information such as strike prices, Call Options, Put Options, Open Interest (OI), Change in Open Interest, trading volume, and option premiums. By analyzing this data, traders can identify where market participants are creating positions and which strike prices are attracting the most activity.
It is widely used in Nifty options, Bank Nifty options, and stock options trading. Traders use it to identify support and resistance levels, understand bullish and bearish sentiment, select suitable strike prices, and analyze market strength. Instead of relying only on price movement, Option Chain Analysis helps traders gain a broader view of market activity and make more informed trading decisions.
Why Option Chain Analysis is Important
Option Chain Analysis is important because it helps traders interpret market data in a more organized and practical way. It provides a deeper view of market activity by showing how different strike prices are being traded and where market participants are focusing their attention. This allows traders to move beyond guesswork and make decisions based on actual market information. Here are the key reasons traders use Option Chain Analysis:
● Understanding where significant market activity is taking place.
● Tracking changes across different strike prices.
● Identifying areas attracting strong trader interest.
● Monitoring shifts in market participation throughout the trading session.
● Understanding how option premiums react to market movement.
● Evaluating the strength of trading activity at various price levels.
● Comparing Call Option and Put Option activity.
● Gaining additional confirmation before entering trades.
● Understanding expiry-related market behavior.
● Improving market observation and analytical skills.
● Supporting a more structured trading approach.
● Helping traders interpret market data more effectively.
Because it provides valuable insights into option market activity, Option Chain Analysis has become an important part of market analysis for many options traders.
Components of an Option Chain
An option chain contains multiple data points that help traders understand market activity and analyze options contracts more effectively. Every row and column in an option chain provides specific information about trading behavior, strike prices, option premiums, and market participation. Before learning advanced Option Chain Analysis, traders should first understand the key components that make up an option chain.
Each component serves a different purpose and helps traders interpret market data from a different perspective. When combined, these components provide a clearer picture of what is happening in the options market and where traders are focusing their attention.
1. Call Options
Call Options appear on one side of the option chain and represent contracts that generally benefit when the price of the underlying asset moves higher. Traders who expect a bullish market often use Call Options to participate in upward price movement.
When analyzing an option chain, traders often compare activity across different Call Option strike prices. This helps them understand where significant trading activity is occurring and which strike prices are attracting attention from market participants.
Call Option data is one of the most frequently analyzed sections of an option chain because it provides valuable information about trader positioning and market expectations.
2. Put Options
Put Options appear on the opposite side of the option chain and represent contracts that generally benefit when the underlying asset moves lower. Traders who expect bearish market conditions often use Put Options as part of their trading strategy.
Just like Call Options, Put Option data can help traders understand activity across different strike prices. Comparing Put Option activity at various levels helps traders identify where market participants are concentrating their trades.
Both Call and Put Option data are important because they provide different perspectives on market activity and trader behavior.
3. Strike Price
The strike price is one of the most important components of an option chain. It represents the predefined price level associated with an option contract. An option chain contains multiple strike prices above and below the current market price. Traders analyze activity across these strike prices to understand where trading interest is concentrated.
For example, if Nifty is trading at 25,000, the option chain may display strike prices such as:
• 24,800
• 24,900
• 25,000
• 25,100
• 25,200
By comparing data across these strike prices, traders can better understand how market participants are positioning themselves.
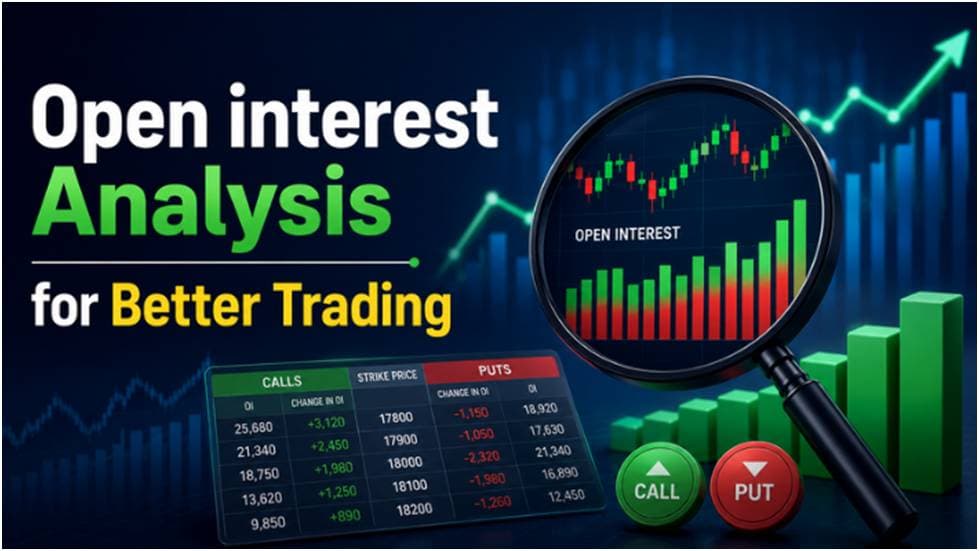
4. Open Interest (OI)
Open Interest is one of the most widely used components of Option Chain Analysis. It shows the total number of active option contracts that remain open in the market. Unlike trading volume, Open Interest represents contracts that have not yet been closed, settled, or expired. Higher Open Interest often indicates greater market activity at a particular strike price.
Traders closely monitor Open Interest because it helps them identify areas where significant trading interest exists. Many traders use Open Interest as part of their overall market analysis process because it provides valuable insights into market participation.
5. Change in Open Interest
Change in Open Interest shows how Open Interest has changed during a specific trading session. This component helps traders understand whether market participants are adding new positions or reducing existing positions.
Positive changes indicate increasing activity, while negative changes indicate a reduction in active contracts. Monitoring changes in Open Interest throughout the day helps traders observe how market activity evolves and where traders are focusing their attention.
6. Trading Volume
Trading volume represents the total number of option contracts traded during a particular period. Volume differs from Open Interest because volume counts all transactions during the day, while Open Interest only counts active contracts that remain open.
Higher volume often indicates increased trading activity and greater participation at a specific strike price. Many traders analyze volume because it provides insights into the level of market interest and activity at different option contracts.
7. Option Premium
Option premium is the price paid by a buyer to purchase an option contract. Premiums change continuously during market hours and are influenced by several factors, including:
• Underlying asset movement
• Time remaining until expiry
• Market volatility
• Demand and supply
Option premiums are displayed in the option chain and are closely monitored by traders because they directly impact trading decisions and profitability. Understanding premium movement is an important part of learning how options trading works
8. Bid Price
The bid price represents the highest price a buyer is currently willing to pay for an option contract. This value reflects current buying interest in the market. A higher bid price generally indicates stronger demand for a particular option contract, while lower bid prices may indicate weaker buying interest.
Traders often review bid prices before entering or exiting trades to understand current market conditions.
9. Ask Price
The ask price represents the lowest price a seller is willing to accept for an option contract. The difference between the bid price and ask price is known as the bid-ask spread.
In highly active contracts, the spread is often smaller, while less active contracts may have wider spreads. Understanding ask prices helps traders evaluate liquidity and trading costs before executing trades.
10. Bid-Ask Spread
The bid-ask spread is another important component of an option chain. It represents the difference between:
• The highest price buyers are willing to
pay
• The lowest price sellers are willing to accept
Smaller spreads often indicate better liquidity and more active trading conditions. Larger spreads may indicate lower trading activity and potentially higher trading costs. Traders prefer option contracts with relatively tight spreads because they often provide smoother trade execution.
11. Implied Volatility (IV)
Implied Volatility, commonly called IV, reflects the market's expectation of future price movement. It does not predict direction but provides an estimate of expected volatility.
Higher IV generally indicates that the market expects larger price movements, while lower IV indicates expectations of smaller price fluctuations. Implied Volatility plays a significant role in option pricing and can influence premium values even when the underlying asset remains relatively stable.
Because of its impact on option premiums, IV is considered an important component of Option Chain Analysis.
12. Expiry Date
Every option contract has an expiry date, which determines how long the contract remains active. Option chains often display data for multiple expiry dates, allowing traders to analyze contracts with different time horizons. The expiry date affects:
• Option premium values
• Time decay
• Trading activity
• Volatility behavior
Traders pay close attention to expiry-related changes because market behavior can differ significantly as expiry approaches.
13. Last Traded Price (LTP)
The Last Traded Price shows the most recent price at which an option contract was traded. LTP provides traders with real-time information about current market pricing.
Many traders monitor LTP to track premium movement and compare current prices with previous trading activity. It is one of the most frequently viewed data points in an option chain.
Why Understanding These Components Matters
Understanding the components of an option chain is essential because each component provides a different piece of market information. While one data point may show trading activity, another may reveal market participation, pricing behavior, or volatility expectations.
Successful Option Chain Analysis does not depend on a single component. Instead, traders learn how different data points work together to provide a broader understanding of market conditions. By becoming familiar with components such as strike prices, Open Interest, volume, option premiums, bid-ask spreads, and implied volatility, traders can build a stronger foundation for analyzing option chains and making more informed trading decisions.
How to Read an Option Chain
Understanding how to read an option chain is one of the most important skills for options traders. Many beginners look at an option chain and feel overwhelmed because it contains a large amount of data spread across multiple strike prices. However, once traders understand what each section represents, reading an option chain becomes much easier.
An option chain provides a detailed view of option contracts available for a particular stock or index. It displays information such as Call Options, Put Options, strike prices, Open Interest, Change in Open Interest, trading volume, and option premiums. By analyzing this information, traders can better understand market activity and make more informed trading decisions.
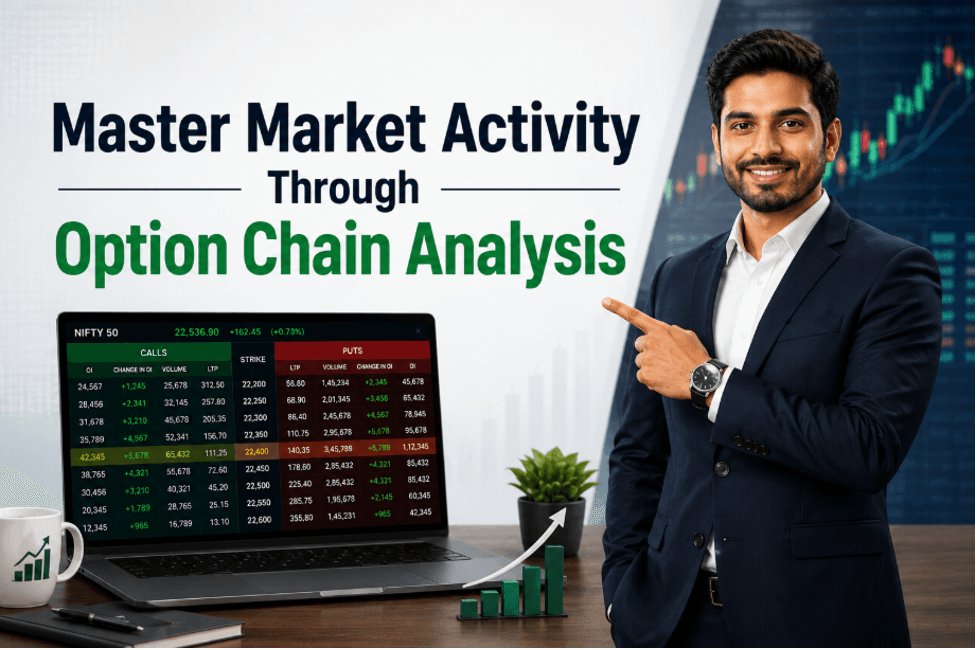
1. Understanding Option Chain Layout
Before analyzing any data, traders should understand how an option chain is organized. Most option chains are divided into three sections:
• Call Option data on the left side
• Strike prices in the middle
• Put Option data on the right side
Each row represents a specific strike price, while each column contains different data points related to that strike price. A typical option chain may display:
• Open Interest (OI)
• Change in Open Interest
• Trading Volume
• Implied Volatility (IV)
• Last Traded Price (LTP)
• Bid Price
• Ask Price
• Strike Price
The strike price column acts as the center of the option chain. Traders compare data on both sides of the strike price to understand activity in Call and Put Options. Learning the layout is the first step because it helps traders quickly locate important information and compare activity across multiple strike prices.
2. Identifying Active Strike Prices
One of the primary objectives of Option Chain Analysis is identifying active strike prices. Active strike prices are levels where market participants are trading heavily and where significant activity is taking place. These strike prices often attract attention because they can provide clues about trader behavior and market interest. Traders generally look for:
• Higher Open Interest
• Higher trading volume
• Large changes in Open Interest
• Significant premium movement
For example, if Nifty is trading at 25,000 and the 25,100 strike price shows unusually high activity compared to nearby strikes, traders may consider it an active strike.
Active strike prices often become important reference points because they indicate where traders are focusing their attention. Monitoring these levels helps traders understand how activity is shifting throughout the trading session.
Instead of looking at only one strike price, experienced traders compare multiple strikes to identify where activity is concentrated.
3. Reading Call Side Data
The Call Option appears on one side of the option chain and contains information related to Call contracts. When reading Call side data, traders often analyze:
• Open Interest
• Change in Open Interest
• Volume
• Premium values
• Bid and Ask prices
• Implied Volatility
Each of these components provides different information about market activity. For example:
• Higher Open Interest may indicate increased participation at a particular strike price.
• Rising volume may indicate growing trading activity.
• Premium changes may reflect changing market expectations.
Traders compare Call Option data across multiple strike prices to identify where activity is increasing or decreasing. The goal is not simply to look at one number but to understand how different data points interact with each other. By studying Call side data regularly, traders become more familiar with how option market activity changes throughout the day.
4. Reading Put Side Data
The Put Option provides information related to Put contracts. Similar to the Call side, traders analyze:
• Open Interest
• Change in Open Interest
• Volume
• Premium movement
• Bid and Ask prices
• Implied Volatility
Reading Put side data helps traders understand how activity is distributed across different strike prices. Traders compare Put activity with Call activity because it provides a broader understanding of option market participation.
For example, some strike prices may show strong Put activity while others show stronger Call activity. Observing these differences helps traders understand how market participants are positioning themselves. Reading Put side data is an important part of Option Chain Analysis because it complements information available on the Call side.
5. Understanding ATM, ITM, and OTM Strikes
One of the most important concepts while reading an option chain is understanding ATM, ITM, and OTM strike prices. These categories help traders classify option contracts based on their relationship to the current market price.
ATM (At The Money):
ATM options are strike prices closest to the current market price. For example, if Nifty is trading at 25,000. The 25,000 strike price is generally considered ATM. ATM options often attract significant trading activity because they are closest to the current market level.
Traders focus on ATM options because they provide a balance between premium cost and market sensitivity.
ITM (In The Money):
ITM options already possess intrinsic value.
• For Call Options: Strike prices below the current market price are generally ITM.
• For Put Options: Strike prices above the current market price are generally ITM.
Because ITM options already have intrinsic value, their premiums are generally higher than ATM or OTM options. Traders choose ITM options because they tend to move more closely with the underlying asset.
OTM (Out of The Money):
OTM options do not currently possess intrinsic value.
• For Call Options: Strike prices above the current market price are generally OTM.
• For Put Options: Strike prices below the current market price are generally OTM.
OTM options usually have lower premiums compared to ATM and ITM options. Because of their lower cost, traders find OTM options attractive. However, OTM options may require larger market movements to become profitable.
Understanding the difference between ATM, ITM, and OTM strikes is important because trading activity often varies significantly across these categories.
6. Option Chain Reading Example
Let us understand option chain reading through a simple example. Suppose Nifty is currently trading at 25,000. The option chain displays strike prices such as:
• 24,800
• 24,900
• 25,000
• 25,100
• 25,200
A trader analyzing the option chain may observe:
• Strong activity at the 25,000 ATM strike
• Increased trading volume at the 25,100 strike
• Significant Open Interest at the 24,900 strike
• Active participation across nearby strikes
Instead of focusing on a single strike price, the trader compares data across multiple levels. The trader may examine:
• Which strikes have the highest Open Interest
• Which strikes are experiencing increasing volume
• Which strikes are showing significant changes in activity
• How option premiums are behaving
By combining these observations, traders can develop a clearer understanding of market participation and trading activity. Over time, regularly reading option chains helps traders recognize patterns and become more comfortable interpreting option market data.
Why Practice is Important
Reading an option chain is a skill that improves with experience. The more traders observe option chain data, the easier it becomes to identify important changes and understand market activity.
Beginners often focus on a single component such as Open Interest or volume. However, experienced traders usually analyze multiple data points together because no single component tells the complete story.
A well-rounded approach to Option Chain Analysis involves understanding the layout, identifying active strike prices, analyzing both Call and Put data, and understanding how ATM, ITM, and OTM strikes behave. By developing these skills, traders can build a stronger foundation for more advanced option chain analysis and better trading decisions.
Open Interest Analysis in Option Chain
Open Interest (OI) is one of the most important data points in an option chain. It helps traders understand where market participants are actively creating positions and which strike prices are attracting attention. By analyzing OI, traders can better understand market activity and monitor changes across different option contracts.
1. What Open Interest Tells Traders
Open Interest represents the total number of active option contracts that remain open in the market. It helps traders identify active strike prices and understand where significant participation is taking place.
2. Highest Call OI Analysis
The strike price with the highest Call Open Interest often attracts strong market activity. Traders monitor these levels to understand where Call Option participation is concentrated and how activity changes during the trading session.
3. Highest Put OI Analysis
Highest Put Open Interest shows the strike prices where Put Option activity is strongest. Comparing Put OI across multiple strikes helps traders identify areas that are attracting significant participation.
4. Change in Open Interest Analysis
Change in Open Interest shows whether OI is increasing or decreasing at a particular strike price. Monitoring these changes helps traders track shifts in market activity and understand how trader participation evolves throughout the day.
5. OI Build-Up Explained
OI Build-Up occurs when Open Interest increases significantly at a strike price. This increase indicates growing market participation and rising activity in that option contract. Traders often monitor build-ups to identify changing market interest.
6. OI Shift and Market Movement
As market conditions change, Open Interest may move from one strike price to another. Tracking these shifts helps traders understand how market focus is changing and where activity is increasing or decreasing.
7. Common OI Interpretation Mistakes
Many traders make the mistake of relying only on Open Interest without considering other option chain data. Ignoring volume, premium movement, or overall market conditions can lead to incomplete analysis. OI should always be viewed as one part of a broader Option Chain Analysis process.
Understanding Open Interest helps traders read option chains more effectively and gain additional insights into market activity. When combined with other option chain components, OI analysis can support more informed trading decisions and improve overall market understanding.
Using Option Chain to Identify Support and Resistance
One of the most common uses of Option Chain Analysis is identifying potential support and resistance levels. Traders often analyze Open Interest data across different strike prices to understand where market activity is concentrated. While option chain data should not be used alone, it can provide valuable insights when combined with price action and market analysis.
1. Support Levels Using Put OI
Many traders monitor Put Open Interest to identify potential support levels. Strike prices with high Put OI often attract attention because significant activity is taking place at those levels. Higher Put participation may indicate strong interest around a particular strike price.
2. Resistance Levels Using Call OI
Call Open Interest is commonly used to identify potential resistance levels. Strike prices with high Call OI often become important reference points because of increased market participation. Traders frequently compare Call OI across multiple strikes to identify areas attracting significant activity.
3. Strong vs Weak Support
Not all support levels carry the same importance. A support level with significantly higher Put OI compared to nearby strikes is often considered stronger than a level with limited activity. Traders usually compare multiple strike prices before determining the strength of a support zone.
4. Strong vs Weak Resistance
Resistance levels can also vary in strength. Strike prices showing higher Call OI and stronger participation may be considered more significant than levels with relatively low activity. Comparing Call OI across different strikes helps traders evaluate resistance strength.
5. Breakout Signals Through Option Chain
Changes in Open Interest can sometimes provide clues about potential breakout situations. A shift in activity away from existing resistance or support levels may indicate changing market participation. Traders often monitor option chain data alongside price movement to identify possible breakout opportunities.
6. Reversal Signals Through Option Chain
Option chain activity can also help traders monitor potential market reversals. Changes in Call and Put Open Interest, combined with shifts in trading activity, may suggest changing market behavior. However, traders typically use additional tools such as price action and technical analysis to confirm reversal signals.
Support and resistance analysis is one of the most practical applications of Option Chain Analysis. By studying Put OI, Call OI, and changes in market participation, traders can gain additional insights into important price levels and overall market activity.
Understanding Market Sentiment Through Option Chain Analysis
Market sentiment refers to the overall attitude of traders toward the market. Option Chain Analysis can help traders understand whether market participants are leaning bullish, bearish, or neutral. By studying Open Interest, trading activity, and strike price participation, traders can gain additional insights into market expectations and positioning.
1. Bullish Sentiment Identification
Bullish sentiment generally reflects positive market expectations. While analyzing an option chain, traders often monitor increasing activity at Put Option strikes, rising participation in certain Call Options, and changes in Open Interest that may indicate growing confidence in upward market movement.
2. Bearish Sentiment Identification
Bearish sentiment reflects negative market expectations. Traders often look for increased activity at Call Option strikes, changes in Put Option participation, and shifts in Open Interest that suggest growing caution among market participants. Comparing activity across multiple strike prices can provide a broader view of market sentiment.
3. Neutral Market Conditions
Markets do not always move strongly in one direction. During neutral or range-bound conditions, option chain activity may be distributed across multiple strike prices without a clear concentration of bullish or bearish participation. Traders often observe balanced activity on both the Call and Put sides during such periods.
4. Trader Positioning Analysis
Option chains provide insights into how traders are positioning themselves across different strike prices. By comparing Open Interest levels, volume, and changes in participation, traders can identify where market activity is concentrated. This information can help traders understand current market behavior and monitor changing participation patterns.
5. Market Strength and Weakness Analysis
Option Chain Analysis can also help traders evaluate overall market strength and weakness. Increasing activity at key strike prices, growing participation, and changes in Open Interest may provide clues about market momentum. However, traders usually combine option chain observations with price action and technical analysis to gain a more complete understanding of market conditions.
Understanding market sentiment through Option Chain Analysis can help traders interpret market activity more effectively. While option chain data does not guarantee future market direction, it can provide valuable information about trader behavior, participation levels, and overall market conditions.
Option Chain Analysis for Strike Price Selection
Selecting the right strike price is one of the most important decisions in options trading. Even if a trader correctly predicts market direction, choosing an unsuitable strike price can affect the outcome of a trade. Option Chain Analysis helps traders compare activity across different strike prices and understand where market participation is concentrated.
By studying Open Interest, trading volume, premium movement, and overall option chain activity, traders can make more informed strike price selections.
1. Choosing the Right Strike Price
There is no single strike price that works for every trader. The choice often depends on market conditions, trading objectives, risk tolerance, and trading strategy. Traders use option chain data to compare different strike prices before selecting a contract.
2. ATM Strike Selection
ATM (At The Money) strike prices are closest to the current market price. These strikes often attract significant trading activity because they are directly linked to current market movement. Many traders prefer ATM options because they generally offer a balance between premium cost and price responsiveness.
3. ITM Strike Selection
ITM (In The Money) strike prices already have intrinsic value. These options generally have higher premiums compared to ATM and OTM options. Some traders choose ITM options because their premiums often move more closely with the underlying asset. However, the higher premium cost is an important factor to consider.
4. OTM Strike Selection
OTM (Out of The Money) strike prices do not currently have intrinsic value. These options usually have lower premiums, making them attractive to traders looking for lower-cost contracts.
However, OTM options may require larger market movements before becoming profitable, which is why traders often evaluate market conditions carefully before selecting them.
5. Strike Selection for Option Buyers
Option buyers often focus on strike prices that align with their market outlook and risk preference. While some traders prefer ATM options for balanced exposure, others may choose ITM or OTM strikes depending on their expectations and strategy.
Option Chain Analysis can help buyers compare activity across multiple strikes before making a decision.
6. Strike Selection for Option Sellers
Option sellers also use Option Chain Analysis when selecting strike prices. They often review Open Interest, volume, and overall activity across different strikes to understand market participation.
Because option sellers typically have different objectives than option buyers, their strike selection process may focus on factors such as premium levels, market conditions, and risk management.
Strike price selection is an important part of options trading, and Option Chain Analysis can provide valuable information during the decision-making process. By understanding ATM, ITM, and OTM strikes and reviewing option chain data carefully, traders can make more informed choices that align with their trading goals and market outlook.
Option Chain Analysis in Nifty and Bank Nifty Trading
Option Chain Analysis is widely used by traders in both Nifty and Bank Nifty trading. Since these indices attract significant options trading activity, their option chains provide valuable insights into market participation, strike price activity, and changes in Open Interest. Many traders regularly monitor Nifty and Bank Nifty option chains to better understand market conditions and trading opportunities.
1. Nifty Option Chain Analysis
Nifty is one of the most actively traded indices in India. Its option chain contains large amounts of data across multiple strike prices and expiry dates. Traders often analyze Nifty option chains to monitor Open Interest, identify active strikes, and observe changes in market participation throughout the trading session.
2. Bank Nifty Option Chain Analysis
Bank Nifty option chains are also closely watched by traders because of the index's active participation and frequent price movement. By studying Bank Nifty option chain data, traders can track activity across various strike prices and observe how market participants are positioning themselves.
3. Comparing Nifty and Bank Nifty Option Chains
Although both option chains contain similar information, trading activity can differ between Nifty and Bank Nifty. Nifty often reflects broader market participation, while Bank Nifty is more closely influenced by banking sector stocks. Comparing both option chains can help traders understand differences in market activity and participation.
4. Intraday Analysis Using Option Chain
Many traders use option chains during intraday trading to monitor changing activity across strike prices. By observing Open Interest changes, volume activity, and premium movement throughout the day, traders can gain additional insights into how market participation is evolving during the trading session.
5. Expiry Day Option Chain Analysis
Option chain analysis becomes especially important on expiry days because trading activity often increases significantly. Traders frequently monitor strike prices with high activity, changes in Open Interest, and premium movement as expiry approaches. Observing these changes can help traders better understand market behavior during one of the most active periods in options trading.
Nifty and Bank Nifty option chains provide a large amount of valuable market information. By regularly analyzing option chain data, traders can improve their understanding of market activity and develop a more structured approach to options trading.
Option Chain Analysis Trading Strategies
Option Chain Analysis is not only used to understand market activity but also to support different trading approaches. Traders often use option chain data to identify opportunities, monitor changing market conditions, and improve trade planning. While strategies may vary from trader to trader, option chain data can provide valuable information before entering a trade.
1. Intraday Trading Strategy
Intraday traders often track real-time changes in option chain data throughout the trading session. Monitoring activity at nearby strike prices can help traders identify where market attention is increasing and which levels are becoming important during the day.
2. Breakout Trading Strategy
Before major price moves, trading activity often increases around specific strike prices. Traders may observe rising participation and growing activity at key levels to identify areas where the market could attempt a breakout.
3. Reversal Trading Strategy
Market reversals are often accompanied by changes in trader participation. By comparing activity across different strike prices, traders can monitor whether market focus is shifting and whether existing momentum is weakening.
4. Trend Following Strategy
When markets are moving in a clear direction, option chain activity often remains concentrated around specific strike zones. Trend-following traders use this information alongside chart analysis to stay aligned with prevailing market conditions.
5. Support and Resistance Strategy
Option chain data can help traders locate price levels that attract significant market participation. These levels often become important reference points for planning entries, exits, and trade management decisions.
6. Expiry Trading Strategy
Option chain behavior often changes as expiry approaches. Traders monitor shifts in activity, premium fluctuations, and changing participation levels to better understand market dynamics during expiry sessions.
No matter which strategy is used, Option Chain Analysis works best when combined with price action, market structure, and proper risk management. Using multiple forms of analysis can help traders make more informed trading decisions rather than relying on a single source of information.
Benefits of Learning Option Chain Analysis
Option Chain Analysis is an important skill for traders who want to better understand options market activity. Instead of relying only on price charts, traders can use option chain data to gain additional insights into strike price activity, trader participation, and changing market conditions. Learning how to read an option chain can support a more structured and informed trading approach.
1. Better Market Understanding
Option Chain Analysis helps traders understand how activity is distributed across different strike prices. By observing option chain data regularly, traders can develop a broader view of market behavior and gain a deeper understanding of how options markets function.
2. Improved Strike Price Selection
Many traders use option chain data when selecting strike prices. By comparing activity across ATM, ITM, and OTM strikes, traders can make more informed decisions and better understand which strike prices are attracting the most market participation.
3. Better Risk Management
Understanding option chain data can support better risk management by helping traders evaluate market activity before entering trades. Reviewing factors such as Open Interest, volume, and strike price participation can contribute to a more disciplined trading approach.
4. Improved Trading Confidence
As traders become more familiar with option chain data, they often gain greater confidence in their market analysis. Understanding how to interpret key option chain components can help traders feel more comfortable when evaluating trading opportunities.
5. More Informed Trading Decisions
Option Chain Analysis provides additional market information that can complement price action, technical analysis, and overall market research. By combining multiple sources of information, traders can make more informed trading decisions rather than relying on a single indicator.
Learning Option Chain Analysis can be valuable for both beginners and experienced traders. With regular practice and observation, traders can improve their understanding of market activity and develop stronger analytical skills for options trading.
Common Option Chain Analysis Mistakes
Option Chain Analysis can provide valuable market insights, but many traders make mistakes while interpreting option chain data. These mistakes can lead to poor analysis and trading decisions. Understanding common errors can help traders use option chain data more effectively and avoid unnecessary confusion.
1. Depending Only on Open Interest
One of the most common mistakes is relying only on Open Interest (OI). While OI is an important component of option chain analysis, it does not provide a complete picture of market activity. Traders should also consider volume, price movement, and overall market conditions.
2. Ignoring Price Action
Some traders focus entirely on option chain data and ignore price action. However, price movement remains one of the most important indicators of market behavior. Option chain analysis is often more effective when used alongside price action analysis rather than as a standalone tool.
3. Misreading Support and Resistance
High Call OI or Put OI does not always guarantee strong resistance or support. Market conditions can change quickly, and activity may shift between strike prices. Traders should avoid assuming that support or resistance levels will always hold.
4. Ignoring Market Trend
Option chain data should always be viewed within the context of the overall market trend. Ignoring broader market direction can lead to incorrect conclusions. Many traders use trend analysis together with option chain observations to gain a more balanced view of the market.
5. Wrong Strike Price Selection
Even when market analysis is correct, choosing an unsuitable strike price can affect trading results. Some traders focus only on low-cost options without considering liquidity, activity, or market conditions. Proper strike price selection is an important part of options trading.
6. Emotional Trading Decisions
Emotions can influence how traders interpret option chain data. Fear, greed, and impatience may lead traders to react too quickly to short-term changes. Maintaining a disciplined and objective approach can help traders avoid emotional decision-making.
Option Chain Analysis is a valuable tool, but it should be used carefully and as part of a broader trading process. By avoiding these common mistakes and combining option chain data with price action, market trends, and risk management, traders can develop a more structured approach to market analysis and trading decisions.
Learn Option Chain Analysis with TSTA
Understanding Option Chain Analysis is an important step for traders who want to improve their market analysis skills. While learning the concepts is important, practical application is equally valuable. At
TRADE SUTRA Trading Academy
(TSTA), traders can learn how option chain data is used in real market
conditions and develop a more structured approach to options trading.
1. Why Option Chain Analysis Matters
Option Chain Analysis helps traders understand market activity, strike price participation, and option market behavior. Learning how to interpret option chain data can improve overall market understanding and support better trading decisions.
2. Learn Through Practical Market Examples
At TSTA, learning goes beyond theory. Traders are introduced to practical market examples that help explain how option chain concepts work in real trading environments. This approach makes complex topics easier to understand and apply.
3. Understanding Real-Time Market Data
Real-time market data plays an important role in Option Chain Analysis. Through structured learning, traders can understand how option chain data changes throughout the trading session and how different market conditions can influence option activity.
4. NISM-Certified Trading Education
TSTA offers NISM-certified trading education designed to help traders build a strong foundation in financial markets. Our courses focus on developing market knowledge, analytical skills, and practical understanding that can support long-term learning and growth in trading.
Whether you are a beginner or an experienced trader, learning Option Chain Analysis through a structured educational approach can help strengthen your market understanding and improve your confidence while analyzing options markets.
Explore Our Trading Courses
Building strong trading skills requires more than simply learning market terminology. A structured learning approach can help traders understand market behavior, improve analytical thinking, and develop greater confidence while making trading decisions. Whether you are a beginner or an experienced market participant, learning can help strengthen your understanding of trading and market analysis.
Explore our trading courses at TSTA and learn through a practical, market-focused approach designed to simplify complex trading concepts. With NISM-certified education, real-market insights, and guidance from experienced mentors, traders can build a stronger foundation in market analysis, risk management, and trading strategies while developing the confidence needed to navigate financial markets more effectively.
Conclusion
Option Chain Analysis is a valuable skill that can help traders better understand options market activity and make more informed trading decisions. By learning how to read option chains, analyze Open Interest, identify active strike prices, understand market sentiment, and monitor support and resistance levels, traders can develop a more structured approach to market analysis.
Whether you trade Nifty, Bank Nifty, or stock options, Option Chain Analysis can provide useful insights into trader participation and changing market conditions. However, it is most effective when combined with price action, risk management, and overall market analysis rather than being used as a standalone tool.
If you want to strengthen your understanding of Option Chain Analysis and practical trading concepts, explore our trading courses at TSTA. Through NISM-certified education and structured guidance, traders can build stronger analytical skills and gain greater confidence in navigating the options market.
Ready to take your market analysis skills to the next level? Join our trading courses at TRADE SUTRA Trading Academy (TSTA) and learn through practical market-focused education designed to help traders build confidence, improve decision-making, and develop a deeper understanding of the financial markets.
Frequently Asked Questions
What is Option Chain Analysis?
Option Chain Analysis is the process of studying option chain data such as Open Interest, volume, strike prices, and option premiums to better understand options market activity and trader participation.
How does Option Chain Analysis work?
Option Chain Analysis works by examining data across different strike prices to identify market activity, participation levels, and changes occurring in the options market.
Why is Option Chain Analysis important?
It helps traders understand option market behavior, identify active strike prices, and gain additional insights that can support trading and market analysis.
What is Open Interest in an Option Chain?
Open Interest represents the total number of active option contracts that have not yet been closed, exercised, or expired.
What is Change in Open Interest?
Change in Open Interest shows whether the number of active option contracts has increased or decreased during a trading session.
Which is more important: Option Chain Analysis or Price Action?
Both are important. Many traders combine Option Chain Analysis with Price Action to gain a more complete understanding of market conditions.
How is Option Chain Analysis used in Nifty trading?
In Nifty trading, traders use option chain data to monitor strike price activity, Open Interest changes, and overall market participation.
How is Option Chain Analysis used in Bank Nifty trading?
Bank Nifty traders often analyze option chain data to understand activity across strike prices and monitor changing market conditions.
What are common mistakes in Option Chain Analysis?
Common mistakes include relying only on Open Interest, ignoring price action, overlooking market trends, and making decisions based on a single data point.
Can Option Chain Analysis predict market direction?
Option Chain Analysis cannot predict market direction with certainty. However, it can provide useful insights into market activity and trader positioning.
What is the difference between Open Interest and Volume?
Open Interest shows the total number of active contracts, while Volume shows the number of contracts traded during a specific period.
What is the role of Implied Volatility in an Option Chain?
Implied Volatility (IV) reflects expected market volatility and can influence option premium prices.
Where can I view Option Chain data?
Option Chain data is available on various stock exchange websites, broker trading platforms, and market analysis tools.
What is PCR in Option Chain Analysis?
PCR (Put-Call Ratio) is a commonly used indicator that compares Put Open Interest or volume with Call Open Interest or volume.
What is Max Pain in Option Chain Analysis?
Max Pain is a concept used by some traders to estimate the strike price where option buyers may experience the maximum loss at expiry.
What is Long Unwinding?
Long Unwinding happens when both price and Open Interest decrease. It generally shows that traders are closing their existing long positions.
What is the significance of the highest Open Interest strike?
The highest Open Interest strike often attracts attention because it represents a strike price with strong market participation.
What happens when Open Interest decreases?
A decrease in Open Interest generally indicates that some existing positions are being closed or reduced.
What is Short Covering?
Short Covering occurs when price rises and Open Interest decreases. It usually indicates that traders are closing their short positions.